Calibrating Thermometers
Homebrewers make a variety of measurements every brewday. We weigh out our malt and hops and perhaps malt extract. We take the mash or steeping temperature. We either boil down to or top up to our target batch volume and then we take the original gravity. If you haven’t calibrated your measuring devices, however, all these measurements could be off, perhaps by a fairly large margin. In this installment of Techniques, I’ll show you how to calibrate your “master” brewing thermometer and your working thermometers.
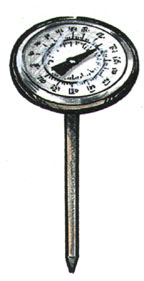
Thermometer
Most homebrewers probably have a variety of thermometers. We may have bimetal thermometers from our mash tuns and hot liquor tanks, glass or digital thermometers for taking spot measurements and “temperature strips” stuck to the side of our buckets or carboys. Many homebrewers, however, may be unaware of how inaccurate thermometers can be. Cheap thermometers can be off by as much as 20 °F (11 °C). Even more expensive thermometers can be off enough to make a difference in brewing. As such, every homebrewer should know how to check and calibrate their thermometers.
Every serious homebrewer should get one good thermometer — a laboratory-grade mercury thermometer or good digital thermometer — and use this to check and adjust their working thermometers. However, even the most expensive thermometers should be checked for accuracy.
To check a thermometer, you should take the temperature of two solutions that you know the temperature of. The Catch-22 here is that, without a calibrated thermometer, how do you know the temperature of a solution? The answer is you rely on the physical properties of water to supply you with two set points.
The best place to start is at the freezing point of water. Pure water freezes at 32 °F (0 °C). If you can make a solution of ice and water right at that point, you can check if your thermometer reads right at freezing. To make a 32 °F (0 °C) solution, do the following:
Take a clean styrofoam cup and fill it with crushed ice, heaped on the top. (Technically, the ice should be made from distilled water, but using tap water won’t affect your result by enough to matter in brewing.) Don’t add any water to the ice. Put the cup in your refrigerator and wait until enough ice melts to submerge your thermometer to a depth that is adequate to take a reading. (Glass laboratory thermometers will have an immersion line showing how far the thermometer tip should be submerged.) It will take a few hours for the ice to melt to this point, so plan ahead. You want to take the temperature of a solution with a lot of ice and just enough water to take a reading.
Note that you can’t just take a (warm) cup, add (warm) tap water, plunk down a few ice cubes and expect the temperature to be 32 °F (0 °C). Waiting for ice to melt ensures the resulting ice and water mixture is right at the freezing point as long the amount of ice is much greater than the amount of water in the mix.
Once the ice water is prepared, take the temperature of the solution. Remember that your thermometer is warmer than the ice water and will warm the local area it is inserted into, so swirl the tip of the thermometer a bit as you take the reading. Keep the thermometer in the slush until it gives a steady reading.
The second point to measure is the boiling point. Water boils at 212 °F (100 °C) at sea level, at standard barometric pressure (29.9 inches of mercury (in. Hg)). But what if you’re not at sea level and standard barometric pressure? Table 1 at the end of this article gives an adjustment factor for boiling water at various altitudes. If you don’t know your altitude, you can find out at the US Geological Survey’s Geographic Names Information System (or the USGS’s GNIS, for acronym lovers) Their web site is located at geonames.usgs.gov (no “www”).
If you wish to take barometric pressure into account, you can find your local barometric pressure at the weather channel (www.weather.com) or from a home barometer — if it’s calibrated! See Table 2 at the end of this article for the correction due to barometric pressure. Add or subtract the value for the correction from the boiling point obtained from Table 1. Alternately, take your reading when your local barometric pressure is between 29.6 and 30.2 inches of mercury (in. Hg) and you’ll be off by a 1/2 degree Fahrenheit (0.28 °C) at most. (There’s also a web site that can do these calculations for you — www.biggreenegg.com/boilingPoint.htm.)
Now all you need to do is boil some water, preferably distilled water, and take its temperature. Don’t try to kill two birds with one stone and check your thermometer next time you boil some wort. Because of the dissolved solids in wort — sugars, proteins, etc. — it boils at a higher temperature than water (around 215 °F/101 °C for an average-strength wort at sea level).
If you’re lucky, your thermometer reads right at both points. If so, you can use this thermometer with confidence (although it’s always possible there is a non-linear response over the thermometer’s range). Or, perhaps it was off by the same amount at both points. For example, maybe it was two degrees low for both readings. In this case, all you need to do is compensate by simple addition or subtraction. In our example, you would need to add 2 to every reading to get the actual temperature. But what if one reading was right and the other was off? Or one reading was high and one was low? In that case, you’ll need to make a calibration curve.
The calibration curve
Once you have your freezing and boiling temperature measurements, you are ready to make a calibration curve for your thermometer. The easiest way to do this is make a graph. Take a piece of graph paper and label the x and y axis from 30 to 220 (or 0 to 100, if you are using Celsius units). Now, make two points on the graph corresponding to your two measurements. The first coordinate gives what the reading should have been and the second coordinate gives what your thermometer read. For example, if your freezing measurement read 34 °F (1 °C), put a point at (32, 34). In other words, go to 32 on the x axis and trace a perpendicular line to 34 and place a dot there. If your boiling reading was 206 °F (97 °C), place a point at (212, 206). (Or maybe you live at an elevation where water should boil at 209; then you’d make a point at 209, 206.) Now draw a straight line between these two points. This line is your calibration curve.
There are two ways you can use this curve. The first is to find out what the actual temperature is given your thermometer reading. To do this, take your thermometer reading and find that value on the y axis. Trace a horizontal line at this y value until it intersects the calibration curve, then trace a vertical line straight to the x axis. The line will intersect the x axis at the actual temperature.
The second way to use the curve is to figure out what your thermometer should read at a given temperature. For example, let’s say you wonder what value your thermometer will give at 150 °F (66 °C). In this case, just reverse the procedure from the previous example. Find 150 °F (66 °C) on the x axis and trace a vertical line to the calibration curve, then trace a vertical line to the y axis. The thermometer’s reading is the value at which the line crosses the y axis.
Working thermometers
Once you’ve calibrated your best thermometer using the methods above, you should use it as a reference to calibrate the rest of your thermometers.
Dial thermometers often have a screw in back that allows you to shift the needle up or down the temperature scale. You should use your calibrated thermometer to calibrate your dial thermometer(s) at a value within the range that you most use the dial thermometer for. For example, when calibrating a dial thermometer on your mash tun, you’ll probably want to calibrate it for a value between 148 °F (64 °C) and 162 °F (72 °C) — the span of the starch conversion range.
Let’s say you mash at 152 °F (67 °C) frequently. To calibrate your dial thermometer to this temperature, heat some water until your calibrated thermometer indicates the actual temperature is 152 °F (67 °C). Now, take the temperature of the water with your dial thermometer and adjust the screw until it reads 152 °F (67 °C). That’s it; now your dial thermometer will read correctly in the vicinity of this point.
You may also want to check the same thermometer out at different temperatures. For example, you may want to see how your 152 °F (67 °C) calibrated thermometer reads at 131 °F (55 °C) (beta glucan rest temperature) or 170 °F (77 °C) (typical mash out temperature). If the thermometer’s reading is off, use a permanent marker to highlight any key temperatures that may be important to you right on the dial. Keep in mind that dial thermometers need to be checked occasionally because they can “drift” over time.
For glass spirit thermometers — the kind with the red liquid inside — you can use your calibrated thermometer to check the readings at a variety of useful temperatures. Use a permanent marker (or colored nail polish) to mark your frequently used temperatures right on the thermometer. Likewise, for digital thermometers that can’t be directly calibrated, you can make an index card with a two-column chart. In one column, put a list of your frequently used temperatures. In the second column record what your digital thermometer actually reads at those temperatures. Like dial thermometers, digital thermometers should be checked occasionally.
Table 1
Boiling Point of Water at Different Elevations Altitude (ft) Boiling Point
Elevation/Boiling Point
-500 / 212.9 ºF (100.5 ºC)
0 / 212.0 ºF (100 ºC)
500 / 211.1 ºF (99.5 ºC)
1000 / 210.2 ºF (99 ºC) 2000 208.4 ºF (98 ºC)
2500 / 207.5 ºF (97.5 ºC)
3000 / 206.6 ºF (97 ºC)
3500 / 205.7 ºF (96.5 ºC)
4000 / 204.8 ºF (96 ºC)
4500 / 203.9 ºF (95.5 ºC)
5000 / 203.0 ºF (95 ºC)
5500 / 202.0 ºF (94.4 ºC)
Table 2
Effect of Barometric Pressure on Boiling Point
Pressure (in. Hg) Change in BP (°F)
28.8 / -1.87 ºF (-1.04 ºC)
29.0 / -1.53 ºF (-0.85 ºC)
29.2 / -1.19 ºF (-0.66 ºC)
29.4 / -0.85 ºF (-0.47 ºC)
29.6 / -0.52 ºF (-0.29 ºC)
29.8 / -0.19 ºF (-0.11 ºC)
29.9 / 0 ºF (-0 ºC)
30.0 / +0.14 ºF (-0.08 ºC)
30.2 / +0.46 ºF (-0.26 ºC)
30.4 / +0.79 ºF (-0.44 ºC)
30.6 / +1.11 ºF (-0.62 ºC)
30.8 / +1.43 ºF (-0.79 ºC)
31.0 / +1.75 ºF (-0.97 ºC)