The Impact of Fermentation on Aroma
In the “Mail” of the December 2019 issue of BYO, the question was asked “Does fermentation really strip hop volatiles?” This question piqued my interest as a homebrewer and analytical chemist.
The aggressive bubbling coming out of my fermenter is always a reassuring sign that my brew day was successful and the yeast cells are doing their job. The aroma coming out of the airlock is one of my favorite fragrances, but I wondered if it could tell me anything about what’s happening to my beer. Luckily, I work for a company (JEOL USA) that makes equipment for chemical analysis and electron microscopes, and this gives me the opportunity to work with state-of-the-art analytical equipment.
My current brew is a 5-gallon (19-L) batch of stout brewed with 12 lbs. (5.4 kg) of Maris Otter, 0.75 lbs. (0.34 kg) each of chocolate malt and roasted barley, and 1.5 lbs. (0.68 kg) of Carapils. I added 1.5 ounces (42 g) of second-year homegrown Columbus hops at the start of the boil and 1 ounce (28 g) of Fuggle pellets at flameout. After cooling the wort, I pitched two packs of Wyeast 1098 (British Ale) yeast and fermentation started within a few hours. By the next morning, the airlock was bubbling away happily and I knew this was an opportunity to analyze the gases coming out of the fermenter. To explain how I did that, I need to provide some background on the science.
Gas Chromatography and GC-MS
Beer is a complex mixture of ethanol, proteins, carbohydrates, and flavor and aroma compounds from hops and fermentation byproducts. We can’t analyze all of the different components with a single method, but we can use a device called a gas chromatograph (or “GC”) to analyze the volatile components. Gas chromatographs are used by large breweries to identify compounds that result in off flavors as well as positive flavors. These include diacetyl (butterscotch flavor), acetaldehyde (green apples), and dimethyl sulfide (vegetable). You can find some nice pictures of a gas chromatograph on Stone Brewing Co.’s webpage (https://www.stonebrewing.com/blog/stochasticity-lab/2014/gas-chromatograph) and an explanation about how they use it to detect those compounds and hydrogen sulfide (rotten egg aroma). Gas chromatography is also one of the main methods used to characterize the essential oils from different hop varieties. It has become an important tool for terpene profiling in the emerging cannabis industry (for the other well-known member of the family that hops belong to).

To explain how a GC works, I think of a “kitchen chemistry” experiment I did in elementary school. The experiment is simple, and you can try it yourself if you’re interested. First, you put small drops of different food colors onto a small spot on a strip of paper towel. Then you dip the end of the paper towel in a small amount of water so that the water creeps up the paper past the spot of mixed food colors and continues to travel up the paper by capillary action. As the water creeps up the paper towel, the colors will separate. A simplified explanation is that some colors are “stickier” than others and take longer to creep up the paper. This is a simple version of a technique called paper chromatography (in fact, the term “chromatography” comes from the Greek word for “color” (chroma) and “to write” (graphein). Paper chromatography has largely been replaced by other methods, but it still has applications to home winemaking and forensic ink analysis.
A gas chromatograph uses a similar principle. We use a syringe to introduce a tiny amount of sample into a hot injector port to vaporize the molecules. Helium gas carries the vapor through a long (98 foot/30 meter) thin fused silica tube (“GC column”) that is coated inside with “sticky” material such as polysiloxane (silicone polymer). As the vapor travels through the column the different molecules separate, just like the food coloring on the paper towel. The GC column is mounted inside an oven and the oven temperature controls the separation rate to pass the different chemicals out of the column, one at a time. The time it takes a compound to travel through the GC column is called the retention time. There are different ways to detect when a compound exits the GC column, and the retention times can often be used to identify compounds in a mixture. The relative strength of the signals in the mass spectra is related to the concentration of the different chemicals in the mixture. The retention time is not always enough information to identify a compound, but we can combine the GC with a more powerful detector such as a mass spectrometer.
Mass Spectrometers
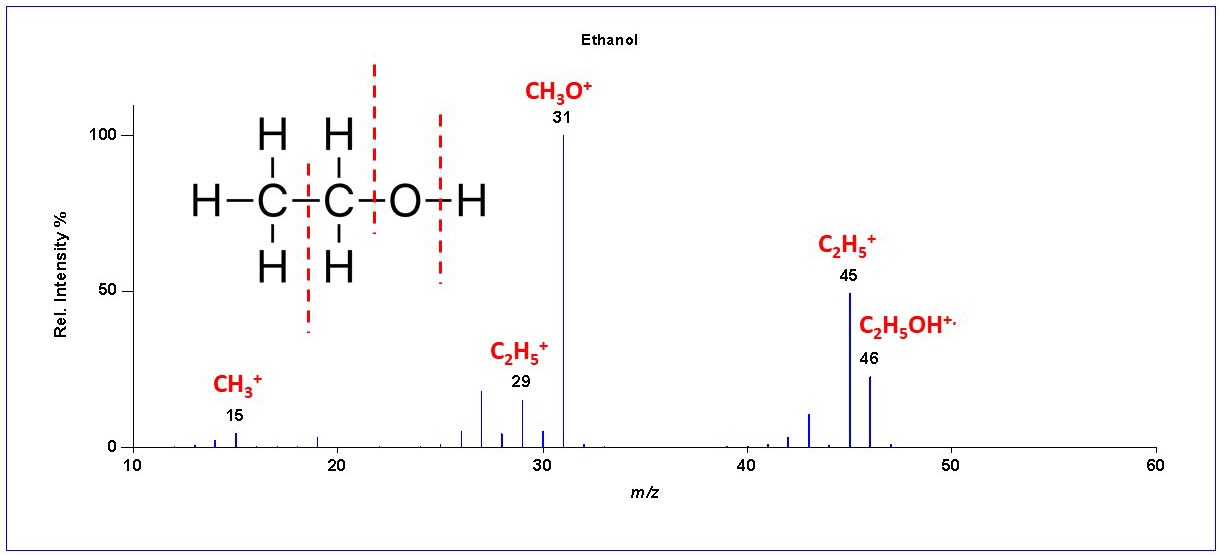
Mass spectrometers are instruments that use electric and/or magnetic fields to measure the mass of atoms and molecules. That may not sound very useful (“why do we need such an expensive balance?”), but the mass actually tells us a lot about the chemicals we are analyzing. Let’s use ethanol as a simple example. The formula for ethanol is C2H5OH, containing a total of two carbon atoms, 6 hydrogen atoms, and one atom of oxygen. A carbon atom has a mass of 12 u (“unified atomic mass units”), a hydrogen atom has a mass of 1, and an oxygen atom has a mass of 16 u, so the mass of an ethanol molecule is (2 x 12) + 6 + 16 = 46 u. When we analyze ethanol in a traditional mass spectrometer (“MS”) we see a mass spectrum with a peak at mass 46 (C2H5OH+•). The “+” in the formula denotes a positive charge, and the “•” means that there is an unpaired electron because the ionizing electron knocked an electron off the molecule.
Because we use relatively high-energy electrons (70 electron volts) to ionize the molecule, the molecule also breaks up in the mass spectrometer ion source into fragments. As an analogy, imagine that the electrons are bullets that we are shooting at the molecules. Some of the bullets do a little bit of damage, and some cause a lot of damage. For ethanol, the mass spectrometer detects fragments with masses of 15 (CH3+), 29 (C2H5+), 31 (CH3O+), and 45 (C2H5O+). That gives us “puzzle pieces” that we can use to figure out the chemical structure. It would be a lot of work if we had to figure out all of the molecules in a beer sample that way! Instead, we let the computer search the fragmentation pattern in the measured mass spectrum for matching patterns in a database1. See Figure 1, below.
Figure 1: Mass Spectrum of Ethanol
There are many different kinds of mass spectrometers. I used a “quadrupole” mass spectrometer for this analysis. That’s the most common and least expensive type of mass spectrometer, but its operating principle is a little bit hard to explain. Instead I’ll use a “time-of-flight” mass spectrometer as an example because the physics are very simple. First, we introduce the chemicals into a vacuum and heat them so that they evaporate. Then we put an electrical charge on the molecules we want to analyze. The electric charge acts like a “handle” that allows us to use an electric field to move the charged particles (called “ions”). The most common mass spectrometers do this by vaporizing the sample and then shooting a beam of electrons through the gas. Some of the electrons hit a molecule and knock off a (negatively charged) electron, producing a molecule with a positive charge. The electron beam has enough energy to break apart some of the molecules to produce fragments like we saw in the mass spectrum of ethanol. All of this is done in a vacuum chamber so that the ions won’t collide with air molecules that would slow them down or cause chemical reactions that change what we measure.
Now we apply a fast high-voltage electric pulse to accelerate the ions. Ions with smaller masses move faster than ions with larger masses. Imagine that you have a golf ball, a croquet ball, and a bowling ball and that you give them a whack with a club. The golf ball will move fastest, then the croquet ball, and the bowling ball will barely move at all. For an example with less risk of concussion to the timer, think of a running race with two equally strong runners, but one is lighter than the other. All other things being equal, the lighter runner is going to finish first. In physics terms, force is equal to mass times acceleration. For a constant force, a smaller mass will have a larger velocity and vice-versa. The time-of-flight mass spectrometer works the same way — we have fast electronics that record the time ions takes to travel from the ion “source” to the “detector.”
If we put the end of the GC column into the ion source of a mass spectrometer (GC-MS), we can get a mass spectrum of each separate compound as it elutes from the column. The information from the mass spectral database search and the GC retention time tells us which molecule we have detected. The relative strength of the signals in the mass spectra is related to the concentration of the different chemicals in the mixture. GC-MS systems are very common in analytical laboratories, but they typically are only available in larger breweries.
Back to the Brew
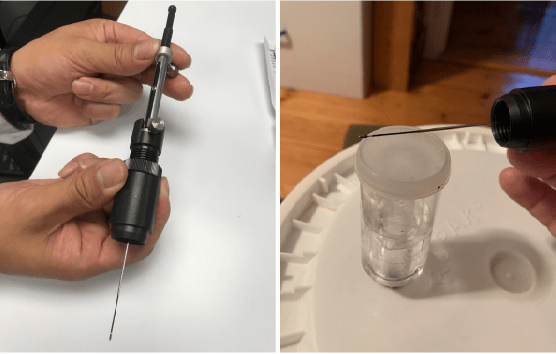
How did I analyze the gases coming out of the fermenter? I wasn’t going to carry my fermenter to work, and I certainly wasn’t going to bring the GC/MS system home! I could have taken a gas-tight syringe and sampled some of the vapor, but that would not be very efficient. In addition, I’d be sampling a lot of air along with the fermentation aroma. Instead, I used something called Solid-Phase Microextraction or SPME (pronounced “spee-me”). In short, a SPME fiber is a special needle that’s coated with absorbent materials (like activated charcoal) that collects the aroma chemicals, but not the air. I used the Restek “SPME Arrow,” which seals the fiber inside the needle when not in use, making it easy to transport the airlock sample without picking up external contamination. I took the SPME Arrow home on day 1 after I pitched the yeast when the fermentation was most active and held the fiber above the airlock for a few minutes. For good measure, I even inserted it for a minute or so directly into the airlock through one of the holes. Then I took it to work and injected the needle into the injector of the GC-MS system and started the analysis.
Figure 2: Chromatograph Day 1 Results
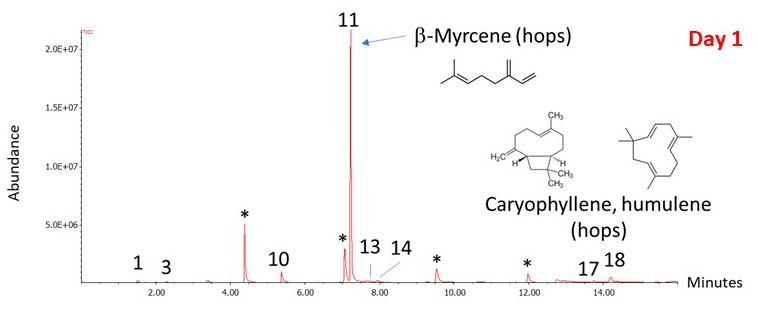
You can see the results in Figure 2 which shows the chromatogram with the results of the airlock analysis. The horizontal axis represents the retention time (the time it takes each compound to go through the GC column), and the vertical axis is related to the concentration of each compound in the mixture. Each “peak” represents a different compound, and the compounds are identified by their mass spectra (not shown) and their GC retention times. The largest peak corresponds to β-myrcene. β-myrcene is the most abundant aromatic hydrocarbon in the essential oil of hops, making up more than 50% of the essential oil of some hop varieties. Other hop volatiles detected are: β-pinene, γ-terpinene, limonene, sylvestrene, and humulene. The remaining peaks are due to fermentation gases: Amyl acetate (“banana oil,” ethyl acetate, and amyl alcohol). Ethanol is being produced, but it isn’t detected in the airlock gases. In fact, I didn’t detect any significant amount of ethanol in the airlock gases on the following days up until the time that the bubbling was too slow to get a good sample. A possible explanation is the relative solubility of ethanol and larger alcohols. Ethanol is miscible in water, which means that it will dissolve in water at any concentration. Starting with 4-carbon alcohols (butanol), solubility starts to decrease and so they are more likely than ethanol to be lost through the airlock.
So, what does this tell us? It is clear from my GC-MS analysis that hop volatiles ARE being lost through the airlock. That’s not really a surprise! As brewers, we use the term “sparging” to refer to the process of using water to rinse the sugar from the mashed grain, but “sparging” has a different meaning in chemistry. To a chemist, “sparging” means the process of bubbling gas through a liquid to remove other gases or volatile compounds. That’s exactly what is happening during the initial stages of fermentation. The carbon dioxide is aggressively sparging the most volatile compounds out of the wort, and the hop volatiles make up the largest fraction of the gases being removed. Hop volatiles even dominate the airlock gases for my lightly hopped stout. The airlock aroma did not smell particularly hoppy to me, but I attribute that to how the human nose responds to mixtures of aroma compounds. I repeated this experiment for a few days as fermentation progressed, and the pattern didn’t change much. Although the total amount of compounds detected decreased as the bubbling slowed, β-myrcene was always the largest peak. This confirmed that the majority of the loss through the airlock was the hop volatiles. At the end of this article you will see a list of all the major compounds identified in the airlock vapor.
We know from experience that fermentation doesn’t strip all of the hop aroma out of the beer. Late hop additions have become popular in recent years because they work (see “Evolution of Late Hopping” in the July-August 2018 issue of BYO). To get a better picture of the beer aroma after fermentation, I took another sample after 14 days as I transferred the beer to the secondary (see Figure 3). This time, I put a small amount of fermented beer into a sealed vial and used the SPME fiber to take a sample of the headspace vapor. As we would expect, the composition of the vapor has changed dramatically. Ethanol now makes up the largest peak. In fact, the ethanol peak is so large that it is off-scale in the figure, which I have enlarged to show the minor components. The isoamyl alcohol peak is actually only about 4% relative to the ethanol peak. Of course, this is the concentration in the aroma and not necessarily in the beer itself.
Figure 3: Chromatograph Day 14 Results
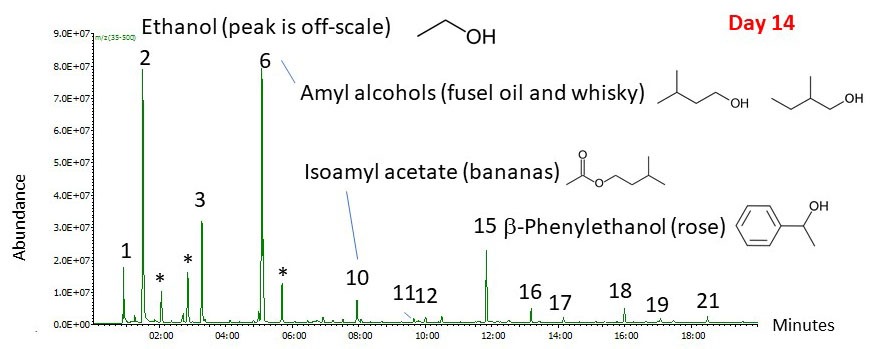
Fermentation has created the esters and higher alcohols that contribute to the beer aroma. Hop compounds are still present in the aroma of the fermented beer, even if their relative concentration has decreased dramatically. The β-myrcene peak has gone from being the largest peak in the airlock chromatogram to being a small peak barely above the baseline.
So, we’ve answered the original question! Fermentation is stripping hop volatiles from the wort, but not completely. For this reason, late hop additions to the boil are not likely to be as effective as dry hopping if you want a strong hop aroma. Of course, there is probably a limit to how much hop aroma of highly-hopped beers like IPAs will be removed through the airlock, but CO2 sparging during fermentation changes the aroma profile for late hop additions because the hop compounds have different volatilities and different solubilities in the beer. β-myrcene is essentially insoluble in water, but it is soluble in ethanol. On the other hand, oxygen-containing hop terpenes like linalool are partially soluble in water. That means that β-myrcene (spicy, herbal aroma) is going to be preferentially lost through the airlock during fermentation, whereas linalool (floral aroma with a hint of citrus) is more likely to be retained. The solubility of both compounds is going to increase if you add them for dry-hopping because of the presence of ethanol in the fermented beer. The Master Brewers Association of Americas has an interesting article on this subject that you can find online at https://www.mbaa.com/brewresources/Documents/Linalool.pdf.
Commercial breweries that have GC/MS capabilities can use them to catch potential problems and to fine-tune the brewing process. The website for Boulevard Brewing Company (www.boulevard.com/2014/01/08/brewing-toys-gcms/) describes how they use GC/MS to detect esters, sulfur compounds, diacetyl, and individual hop oils. They give an example of using GC/MS to measure the profile of Amarillo® hop oils after dry hopping and then adjust the hopping process to match the desired outcome.
Could the airlock volatiles provide any useful diagnostics for the brewing process? I don’t know, but it’s certainly possible! A high relative concentration of fusel alcohols (particularly isoamyl alcohol) might indicate that the fermentation temperature is too high. We might expect a different airlock profile if we are brewing with Belgian yeasts, which produce phenolics, or for German wheat beers with higher concentrations of isoamyl acetate (banana). Bacterial contamination (accidental or deliberate) would probably influence the composition of airlock volatiles. The other compounds that make a beer unique (alpha and beta acids, sugars, proteins) remain in the liquid and are not detected in the aroma. They can be detected by other methods, but that’s a subject for another article.
As for my stout, I added Bourbon-soaked French oak chips, one half of a vanilla bean and a scoop of crushed espresso beans when I transferred the beer to the keg. After about a month of aging the final result came out quite nicely at about 8% ABV.
Notes
1 Of course, it isn’t quite that simple! The colliding electron can add enough energy to a molecule that it causes changes in the molecule’s structure before it fragments. Furthermore, the mass of hydrogen isn’t exactly 1, it’s 1.0078 (to 4 decimal places) and oxygen actually has an exact mass of 15.9949. Most mass spectrometers just measure integer masses (1, 16, etc.), but high-resolution mass spectrometers can measure the masses to several decimal places. To complicate matters, many atoms don’t have just one mass – they have several isotopes with different masses. For example, about 1% of the carbon atoms are carbon-13 atoms with a mass of 13. Computer programs can use all of this information to tell us more about the composition of the molecule. In the table, I am showing the integer mass for compositions using the most abundant isotopes.
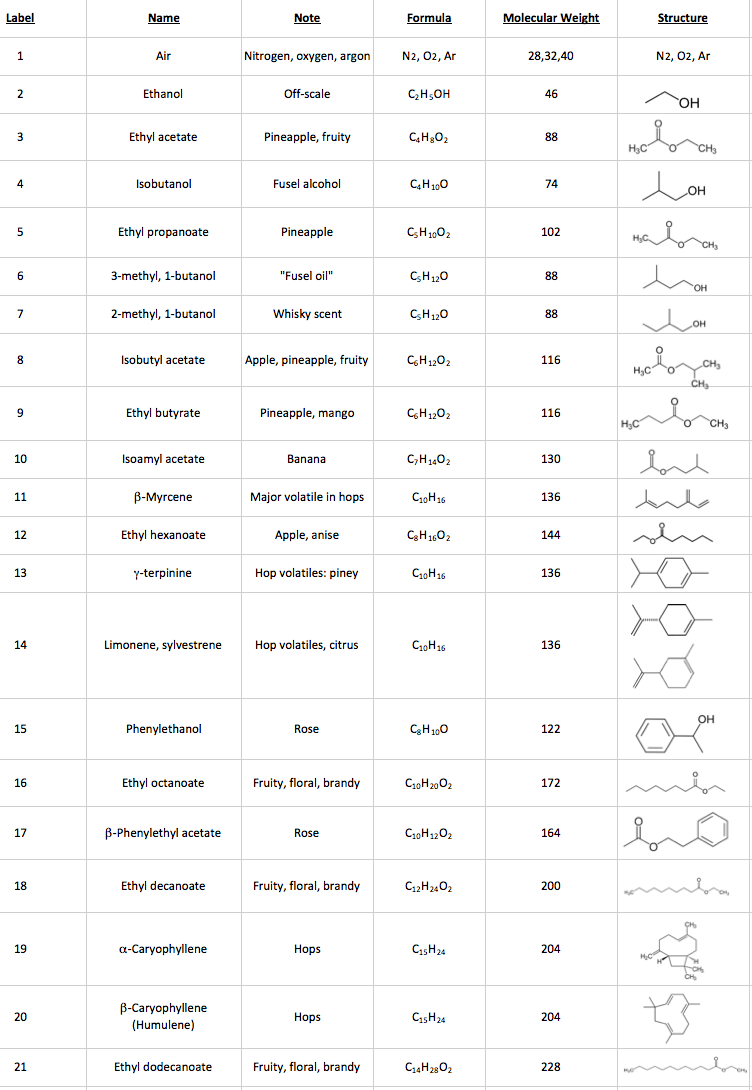
Figure 4: All of the Major Compounds Identified in the Airlock Vapor